![]()

|
|
|
|
|
| 79-82 | % | 87-91 | % | 92-96 | % | TOTAL | % | |
| Trunk | 44819 | 26.7 | 85304 | 29.9 | 114390 | 33.8 | 244513 | 30.9 |
| U Extrem | 46128 | 27.5 | 69698 | 24.5 | 81151 | 24.0 | 196977 | 24.9 |
| L Extrem | 41951 | 24.9 | 65208 | 22.9 | 68224 | 20.2 | 175383 | 22.2 |
| Head | 31030 | 18.5 | 51146 | 18.0 | 60550 | 17.9 | 142727 | 18.0 |
| Neck | 3230 | 1.9 | 3823 | 1.3 | 8263 | 2.4 | 15316 | 1.9 |
| 25-50 % | 454 | 0.3 | 8914 | 3.1 | 4281 | 1.3 | 13649 | 1.7 |
| All Body | 74 | 0.0 | 814 | 0.3 | 1852 | 0.5 | 2740 | 0.3 |
| Unknown | 276 | 111 | 751 | 1138 | ||||
| Known | 167686 | 284907 | 338711 | 791305 | ||||
| Total | 167962 | 285018 | 339462 | 792443 | ||||
| 79-82 | % | 87-91 | % | 92-96 | % | Total | % | |
| Contusion/Abrasion | 64225 | 38.3 | 93766 | 32.9 | 102576 | 30.2 | 260567 | 32.9 |
| Fracture | 42329 | 25.2 | 80348 | 28.7 | 99585 | 29.3 | 222262 | 28.1 |
| Sprain/Strain | 27031 | 16.1 | 48326 | 16.9 | 55460 | 16.3 | 130816 | 16.5 |
| Laceration | 16564 | 9.9 | 25683 | 9.0 | 28766 | 8.5 | 71013 | 9.0 |
| Concussion | 6154 | 3.7 | 10044 | 3.5 | 11612 | 3.4 | 27810 | 3.5 |
| Internal Injury | 1255 | 0.7 | 7990 | 2.8 | 12800 | 3.8 | 22045 | 2.8 |
| Other | 1810 | 1.1 | 4492 | 1.6 | 11442 | 3.4 | 17744 | 2.2 |
| Dislocation | 3624 | 2.2 | 6234 | 2.2 | 6501 | 1.9 | 16359 | 2.1 |
| Hemotoma | 1928 | 1.1 | 3260 | 1.1 | 4045 | 1.2 | 9233 | 1.2 |
All others had less than 1% incidence.
| Year | 1990 | 1991 | 1992 | 1993 | 1994 | 1995 | 1996 |
| Head Injuries | 17.50% | 17.82% | 17.92% | 16.88% | 17.99% | 18.69% | 17.72% |
| Concussion | 2.05% | 4.30% | 3.66% | 3.49% | 3.53% | 4.31% | 1.95% |
| Year | 78-82 | % | 87-91 | % | 92-96 | % | Total | % |
| Unk | 0 | 0.0 | 112 | 0.5 | 132 | 0.0 | 244 | 0.0 |
| 0-4 | 3318 | 2.0 | 5111 | 1.8 | 7301 | 2.2 | 15730 | 2.0 |
| 5-14 | 45504 | 27.1 | 59513 | 20.9 | 68421 | 20.2 | 173438 | 21.9 |
| 15-24 | 56185 | 33.5 | 70454 | 24.7 | 70851 | 20.9 | 197490 | 24.9 |
| 25-44 | 49570 | 29.6 | 116873 | 41.0 | 134389 | 39.65 | 300832 | 38.0 |
| 45-64 | 11422 | 6.8 | 27715 | 9.7 | 52561 | 15.5 | 91698 | 11.6 |
| 65+ | 1685 | 1.0 | 5352 | 1.9 | 5808 | 1.7 | 12845 | 1.6 |
| Total | 167684 | 185018 | 339331 | 792033 |
| Place/Year | 79-82 | % | 97-91 | % | 92-96 | % | Total | % |
| Home | 40557 | 30.2 | 75492 | 42.3 | 73320 | 42.1 | 189369 | 38.9 |
| Sports | 47129 | 35.! | 42508 | 23.8 | 54112 | 31.1 | 143749 | 29.5 |
| Farm | 28240 | 21.0 | 35681 | 20.0 | 20205 | 11.6 | 84126 | 17.3 |
| Public | 11274 | 8.4 | 19597 | 11.0 | 22604 | 13.0 | 53475 | 11.0 |
| Street | 5222 | 3.9% | 4574 | 2.6 | 2721 | 1.6 | 12517 | 2.6 |
| School | 1774 | 1.3 | 675 | 0.4 | 1066 | 0.6 | 3515 | 0.7 |
| Total | 134196 | 178527 | 174028 | 486751 |
| Year | 1990 | 1991 | 1992 | 1993 | 1994 | 1995 | 1996 |
| % Home | 29.8 | 26.6 | 21.9 | 23.0 | 20.3 | 22.7 | 20.7 |
| % Sports | 14.2 | 16.1 | 15.1 | 15.2 | 15.8 | 18.5 | 15.7 |
| 79-82 | % | 87-91 | % | 92-96 | % | Total | % | |
| Male | 64964 | 38.8 | 123631 | 43.4 | 141021 | 41.5 | 329616 | 41.6 |
| Female | 102612 | 61.2 | 161500 | 56.6 | 198399 | 58.5 | 462511 | 58.4 |
| Total | 167576 | 285131 | 339420 | 792127 |
NEISS has provided its figures on horse related injuries for 14 years divided into 1979- 1982. and the two five year periods 1987-1991 and 1992-1996. NEISS stopped recording horse related injuries in 1983 and did not resume until 1987.
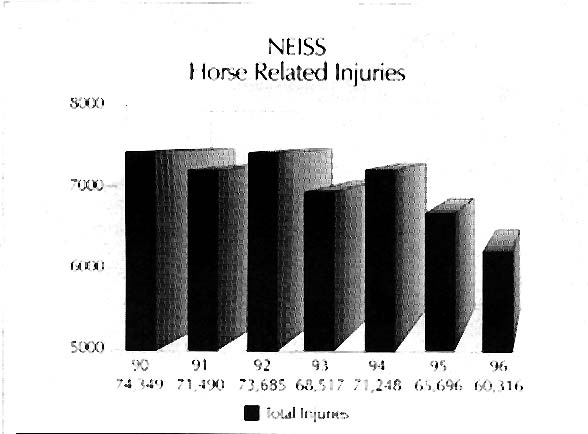
| YEAR | INJURIES |
| 1990 | 74349 |
| 1991 | 71490 |
| 1992 | 73685 |
| 1993 | 68517 |
| 1994 | 71248 |
| 1995 | 65696 |
| 1996 | 60316 |
Preliminary conclusions:
1. The total number of injuries have had an irregular decrease but show the greatest decrease in 1996.
2. The percent of head injuries have had very small changes.
3. Concussions have been essentially unchanged, but there has been a decrease in 1996.
4. The injured between the ages 5-14 and 15-24 years have decreased in the percent of total injuries in each time period while the ages 25-44 and 45-64 years have shown an increase in the percent of total injuries in the same time periods.
5. The gender difference in the percent of accidents show a decrease in the percent of female injuries from 1979-1982 with a corresponding increase in the male injuries. Females had 61.8% of the injuries in 1990 but this had decreased to 54.7% by 1996.
6. In the location involved the percent of injured at "home" have had an increase since 1979-82, but have not risen in the past five years. The percent of injuries in "sport" after a decline in 1987-1991 have increased in the last five years.
National Electronic Surveillance System
Consumer Product Safety Commission
National Information Clearing House
Washington, DC 20207
Protective headgear does not appear to have reduced the percent of head injuries, but the decrease has been in the total number of injuries. If 1996 can be considered the beginning of a trend, concussion with head injury may have decreased. The ages of those injured has shown the greatest change with youth and young adults decreasing their percent of injuries. Persons in the ages 25-44 years after an initial increase in 1987-1992 did not continue the increase in 1992-1996 of their percent of horse related injuries. The ages over 45 years have shown the greatest percent increase in injuries. This may show that youth and young adults follow the rules of safety and accident prevention, while the older riders remain bound by tradition.
Sports which should provide role models by their use of protective headgear and concern for safety, have shown a percent increase in injuries. One cannot wonder if the mandatory use of protective headgear in organized events during part of the years of 1989-1992 might have resulted in the lower number of injuries. Females have reduced their percent of injuries from 1979-1982, but this decrease has not continued in the time spans 1987-91 to 1992-96. (See AMEA News, November 1996, November 1995, February 1994, November 1992.)
Doris Bixby Hammett, MD
|
Contact Information: |
|
|||||
| Phoenix, AZ - Home Office | (602) 992-1570 | Toll Free | (800) 874-9191 | |||
| Del Mar, CA | (619) 866-4482 | Portland, OR | (503) 608-4820 | |||
| FAX | (602) 992-8327 | FAX 2 | (480) 452-0593 | |||
| Mailing Address: 12424 N. 32nd Street #101 Phoenix, AZ 85032 | General Information: ballen@eqgroup.com | |||||
| Customer Service: mpallante@eqgroup.com | Entertainment: entertainment@eqgroup.com | |||||
| Webmaster: ballen@eqgroup.com | Mortality: jpetersen@eqgroup.com | |||||
Allen Financial Insurance Group © Copyright 2007, 2012